3. USING THE CLI
There are seven command line interfaces that have been defined here.
The first CLI, covid19_update_database, only updates the NY Times COVID-19 repository with the latest data.
The next two CLIs, covid19_create_movie_or_summary and covid19_state_summary, synthesize the COVID-19 movies and figures, that represent cumulative cases and deaths, for metropolitan statistical areas (MSAs), the CONUS, or individual US states and territories. The third CLI, covid19_region_summary_rate, synthesizes the COVID-19 movies and figures, that represent seven day averaged new cases and deaths per day, for MSAs, the CONUS, or individdual US states and territories.
The final three CLIs, covid19_movie_updates, covid19_post2server, and covid19_update_readme, are designed for external services to deploy summary data on specific US regions into other locations. A currently private (but perhaps soon to be public) GitHub repo, covid19movies, does the following five things in order.
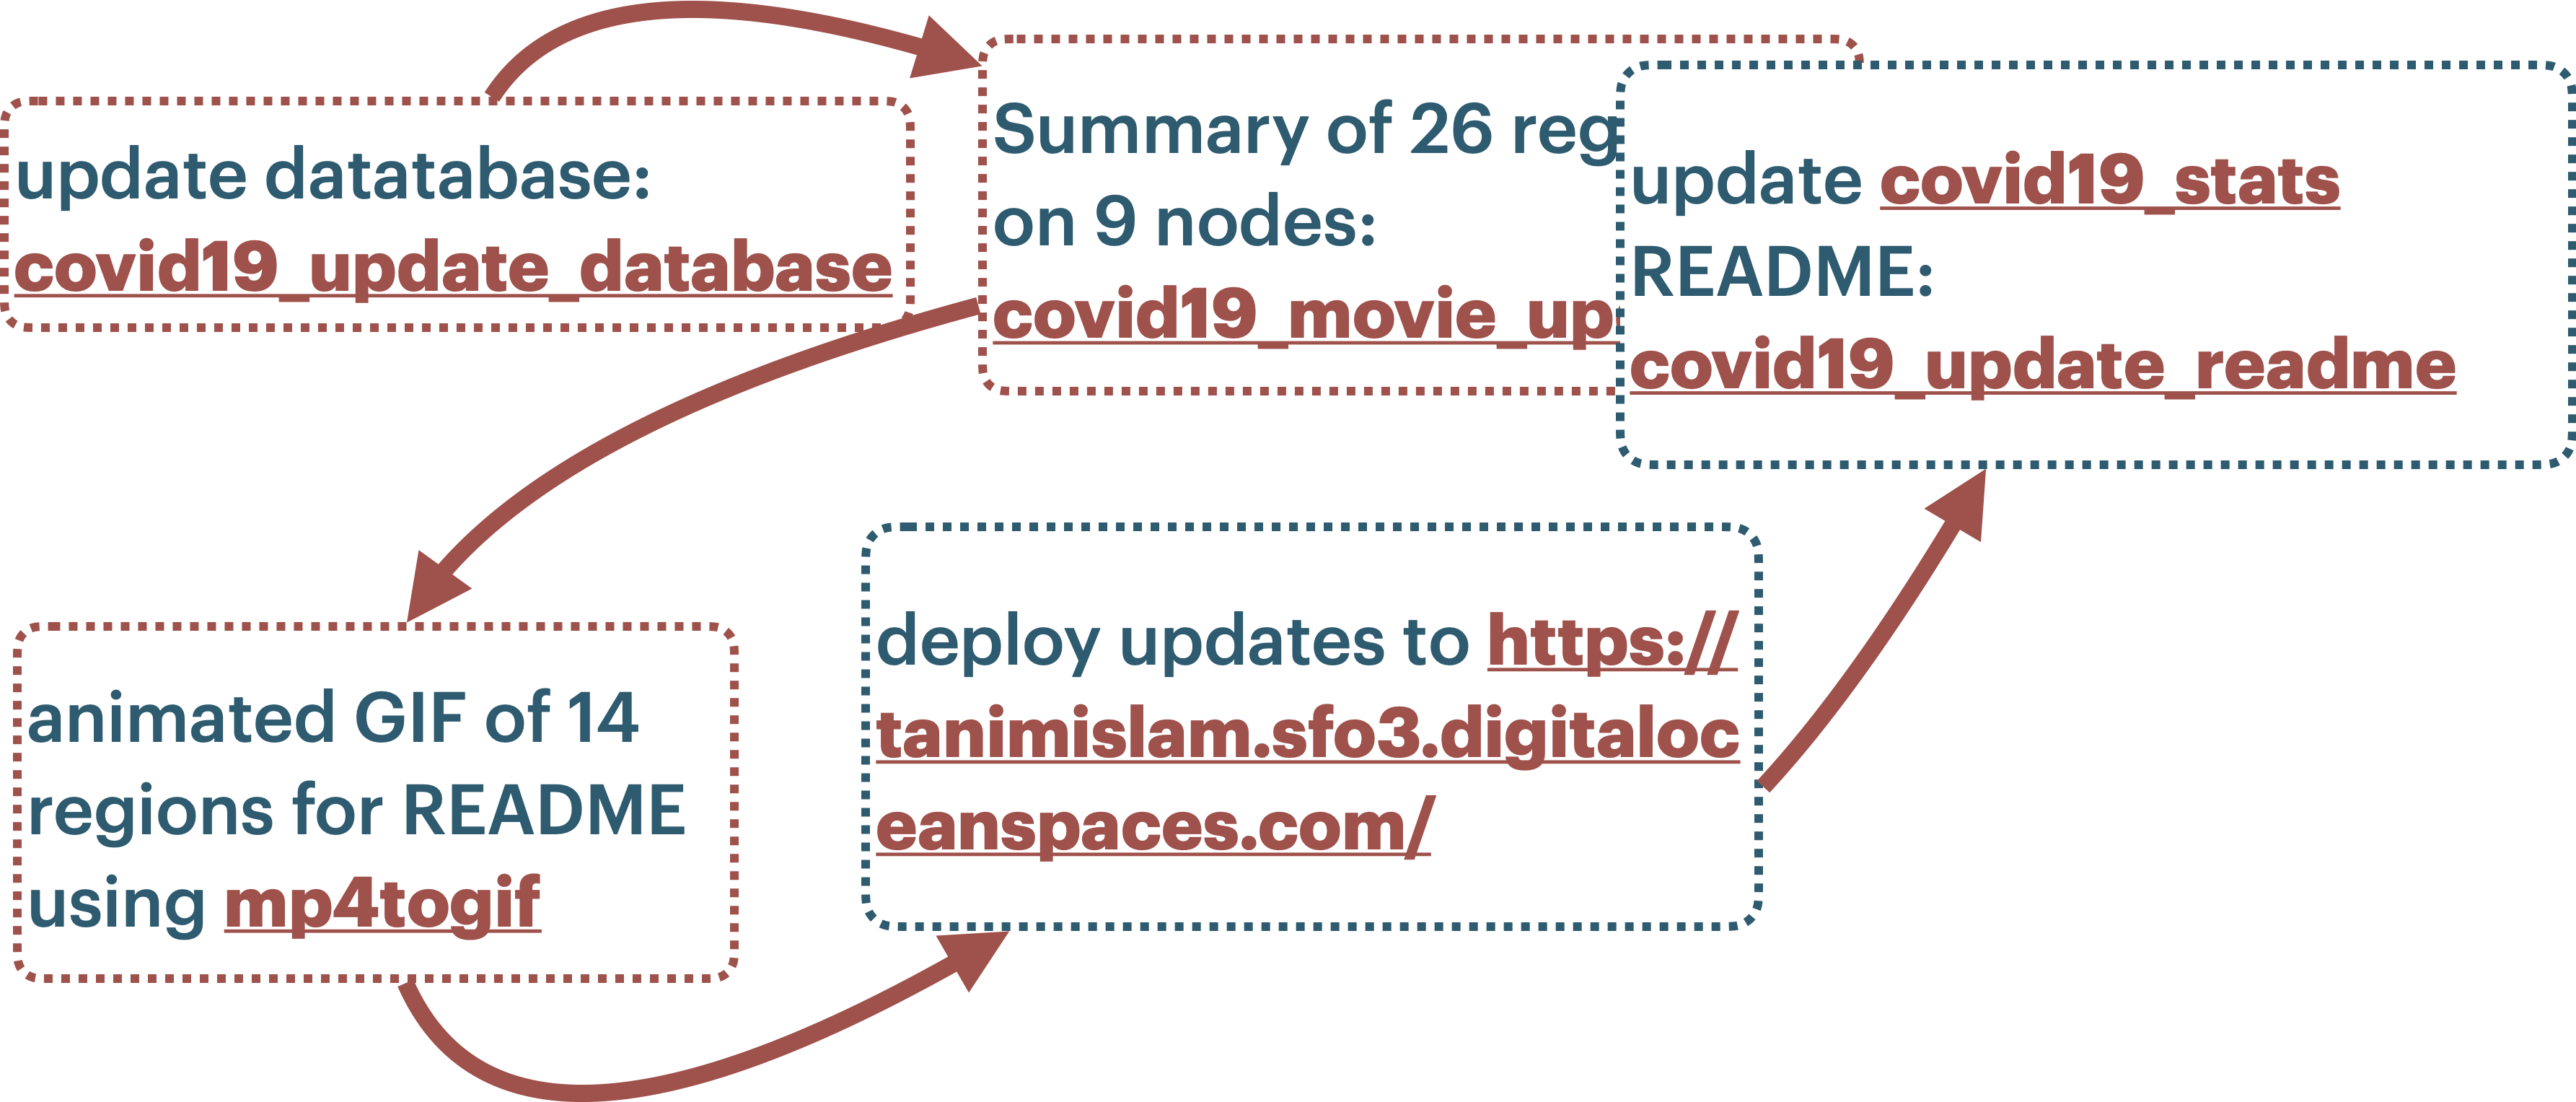
Updates the NY Times COVID-19 data locally by running covid19_update_database.
Creates summary movies of 26 regions (described here) using covid19_movie_updates, using nine nodes on a supercomputing cluster.
Creates animated GIFs of 14 regions, described in the README, using back-end functionality implemented by
mp4togif.Deploys the summary COVID-19 cumulative cases and deaths, movies and figures and JSON files, into https://tanimislam.sfo3.digitaloceanspaces.com/covid19movies.
Updates the covid19_stats repo
READMEusing covid19_update_readme.
This tooling updates the COVID-19 summary data, and the covid19_stats repo README, every day at 1230 AM PST. Here is a diagram!

Fig. 3.1 Diagram taken from a presentation given at the 4 March 2021 Sacramento Python meetup, depicting the five steps needed to update COVID-19 summary data for 26 regions in the United States. As of 4 March 2021, the data takes up nearly 1 GB of space and takes roughly 45 minutes to generate.
Note
I gave a talk to the `Python Charlottesville Meetup <pycho_>`_ on 21 OCTOBER 2021, and developed two new command line tools, covid19_create_region and covid19_region_updates
Here are the nine command line tools.