3.2. covid19_create_movie_or_summary
This CLI is the main top-level CLI currently in the repository. Its purpose is to individually create COVID-19 summary movies and figures, of cumulative cases and deaths, in the Contiguous United States (CONUS) or one of the 380 defined MSAs.
It has four modes of operation. Its help output, when running covid19_create_movie_or_summary -h, produces the following,
usage: covid19_create_movie_or_summary [-h] [-d DIRNAME] [--info] {M,m,s,mcd} ...

positional arguments:
  {M,m,s,mcd}           Choose one of three options: (M) summarizes stats from metros; (m) make a movie of a metro region; and
                        (s) dumps summary plots of last incident date, and cumulative covid-19 stats, of a metro region.
    M                   If chosen, then list all the metropolitan areas through which we can look.
    m                   Make a movie of the COVID-19 cases and deaths trend for the specific Metropolitan Statistical Area
                        (MSA).
    s                   Make a summary plot, and incident data file, of COVID-19 cases and deaths trend, for the specific
                        Metropolitan Statistical Area (MSA).
    mcd                 Make a large-sized movie of either "CASES" or "DEATHS" for given MSA or CONUS.

optional arguments:
  -h, --help            show this help message and exit
  -d DIRNAME, --dirname DIRNAME
                        The directory into which to store the resulting files. Default is /usr/WS2/islam5/covid19_data/nyc.
  --info                If chosen, then print out INFO level logging statements.
The default flags in the top level operation are,
-hshows this help screen.-dor--dirnamespecifies the output directory. Default is the current working directory.--infosays to showINFOlogging output.
3.2.1. summarize MSAs
covid19_create_movie_or_summary M (METRO flag) lists the COVID-19 stats for all, or user-selected, MSAs by population. For example, here are the statistics for the top 30 MSAs.
covid19_create_movie_or_summary M --topN=30

HERE ARE THE 30 METRO AREAS, ORDERED BY POPULATION
DATA AS OF 03 February 2021.
  RANK  IDENTIFIER    NAME                     POPULATION    FIRST INC.          NUM DAYS  NUM CASES    NUM DEATHS    MAX CASE COUNTY    MAX CASE COUNTY NAME
------  ------------  -----------------------  ------------  ----------------  ----------  -----------  ------------  -----------------  ----------------------------------
     1  nyc           NYC Metro Area           19,216,182    01 March 2020            339  1,570,532    52,935        621,218            New York City, New York
     2  losangeles    LA Metro Area            18,711,436    25 January 2020          375  2,003,708    26,385        1,129,957          Los Angeles County, California
     3  chicago       Chicago Metro Area       9,458,539     24 January 2020          376  824,383      15,096        456,144            Cook County, Illinois
     4  dallas        Dallas Metro Area        7,573,136     09 March 2020            331  700,645      7,468         262,738            Dallas County, Texas
     5  houston       Houston Metro Area       7,066,141     04 March 2020            336  490,925      6,087         323,408            Harris County, Texas
     6  bayarea       Bay Area                 6,860,207     31 January 2020          369  330,559      4,012         103,236            Santa Clara County, California
     7  dc            DC Metro Area            6,280,487     05 March 2020            335  367,490      5,913         68,518             Prince George's County, Maryland
     8  miami         Miami Metro Area         6,166,488     06 March 2020            334  660,440      9,256         376,551            Miami-Dade County, Florida
     9  philadelphia  Philadelphia Metro Area  6,102,434     06 March 2020            334  415,562      10,284        111,098            Philadelphia County, Pennsylvania
    10  atlanta       Atlanta Metro Area       6,020,364     02 March 2020            338  481,514      6,006         84,807             Gwinnett County, Georgia
    11  phoenix       Phoenix Metro Area       4,948,203     26 January 2020          374  523,129      8,325         479,978            Maricopa County, Arizona
    12  boston        Boston Metro Area        4,873,019     01 February 2020         368  353,216      9,627         103,162            Middlesex County, Massachusetts
    13  detroit       Detroit Metro Area       4,319,629     10 March 2020            330  248,467      8,266         97,429             Wayne County, Michigan
    14  seattle       Seattle Metro Area       3,979,845     21 January 2020          379  143,511      2,236         79,063             King County, Washington
    15  minneapolis   Minneapolis Metro Area   3,640,043     06 March 2020            334  288,879      3,840         96,262             Hennepin County, Minnesota
    16  sandiego      San Diego Metro Area     3,338,330     10 February 2020         359  241,081      2,683         241,081            San Diego County, California
    17  tampa         Tampa Metro Area         3,194,831     01 March 2020            339  202,358      3,552         101,910            Hillsborough County, Florida
    18  denver        Denver Metro Area        2,967,239     05 March 2020            335  209,203      3,020         56,166             Denver County, Colorado
    19  stlouis       St. Louis Metro Area     2,803,228     07 March 2020            333  245,406      4,217         84,254             St. Louis County, Missouri
    20  baltimore     Baltimore Metro Area     2,800,053     08 March 2020            332  154,795      3,111         47,768             Baltimore County, Maryland
    21  charlotte     Charlotte Metro Area     2,636,883     11 March 2020            329  217,212      2,436         88,055             Mecklenburg County, North Carolina
    22  orlando       Orlando Metro Area       2,608,147     12 March 2020            328  185,303      2,185         104,620            Orange County, Florida
    23  sanantonio    San Antonio Metro Area   2,550,960     12 February 2020         357  213,538      3,142         177,814            Bexar County, Texas
    24  portland      Portland Metro Area      2,492,412     28 February 2020         341  85,605       1,125         30,278             Multnomah County, Oregon
    25  sacramento    Sacramento Metro Area    2,363,730     21 February 2020         348  126,067      1,725         87,106             Sacramento County, California
    26  pittsburgh    Pittsburgh Metro Area    2,317,600     13 March 2020            327  146,373      3,414         70,165             Allegheny County, Pennsylvania
    27  lasvegas      Las Vegas Metro Area     2,266,715     05 March 2020            335  216,121      3,351         216,121            Clark County, Nevada
    28  austin        Austin Metro Area        2,227,083     13 March 2020            327  137,713      1,414         70,631             Travis County, Texas
    29  cincinnati    Cincinnati Metro Area    2,221,208     14 March 2020            326  186,056      1,374         68,156             Hamilton County, Ohio
    30  kansascity    Kansas City Metro Area   2,157,990     07 March 2020            333  132,759      1,600         50,392             Johnson County, Kansas
One can also select MSAs with the --metros flag. The -f or --format flag prints out a table of MSAs formatted in one of three ways: simple, the default, is the tabular format shown above; github is Github flavored Markdown; and rst is reStructuredText. This is described in the help output, produced by covid19_create_movie_or_summary M -h,
usage: covid19_create_movie_or_summary M [-h] [-f {simple,github,rst,rst-simple,json}] [--metros METROS] [--topN TOPN]

optional arguments:
  -h, --help            show this help message and exit
  -f {simple,github,rst,rst-simple,json}, --format {simple,github,rst,rst-simple,json}
                        Format of the table that displays MSA summary. Default is "simple".
  --metros METROS       If chosen, list of selected metros for which to summarize COVID-19 data.
  --topN TOPN           If defined, will be the top N (N must be an integer greater than 0) population metros to get data on.
The standard flag is -f or --format. It asks which of the five formats to spit out the tabulated data to the console.
simpleis the default, and it means to display the tabular data in standard Markdown format. The metro summary table demonstrates this.githubmeans to display the tabular data in standard Github flavored Markdown format.rstmeans to display the tabular data in standard reStructuredText format.rst-simplemeans to display the tabular data using the fancier and better list-table reStructuredText format; its representation is much better and clearer than the standard reStructuredText to represent tables.jsonis the final one, and spits the tabular data out into JSON format.
If you don’t specify the optional arguments, --metros or --topN, then all 380 metros are tabulated.
--metroslooks for a list of MSAs that you have specified.--topNlooks for a positive integer, the top \(N \ge 1\) US metro areas by population.
3.2.2. show mode
covid19_create_movie_or_summary s (SHOW flag) summarizes the latest COVID-19 statistics for a specified MSA. The help output, while running covid19_create_movie_or_summary s -h, is shown below,
usage: covid19_create_movie_or_summary s [-h] [-n NAME] [-M MAXNUM] [--conus]
                                         [-y]

optional arguments:
  -h, --help            show this help message and exit
  -n NAME, --name NAME  Create a summary plot and incident data file of this
                        metropolitan area. Default is "bayarea".
  -M MAXNUM, --maxnum MAXNUM
                        The limit of cases/deaths to visualize. Default is a
                        plausible amount for the chosen MSA or CONUS. You
                        should use a limit larger (by at least 2, no more than
                        10) than the maximum number of cases recorded for a
                        county in that MSA or CONUS.
  --conus               If chosen, then make a movie of the COVID-19 cases and
                        deaths trends for the Continental US (CONUS).
  -y, --yes             If chosen, then do not confirm --maxnum.
The required -n or --name flag specifies the MSA. The -M or --maxnum sets the color limits of cases and deaths to this number (the default is a number that is comfortable above the maximum number of cases in a county in the MSA); and the -y or --yes flag suppresses the intermediate prompt that asks the user whether the specified or default maximum number is sufficient. For example, for the NYC metro area,
bash$ covid19_create_movie_or_summary s -n nyc

HERE ARE DETAILS FOR NYC Metro Area.
2019 EST. POP = 19,216,182.
FIRST CASE:  01 March 2020.
LATEST CASE: 30 January 2021 (335 days after first case)
MAXIMUM NUMBER OF CASES: 603,428 (in New York City, New York)
MAXIMUM NUMBER OF CASES FOR VISUALIZATION: 1,000,000.
CONTINUE (must choose one) [y/n]:
Warning
The command line output shown above for the operation of covid19_create_movie_or_summary s -n nyc is for 31 JANUARY 2021. Example images shown below are for this or later dates.
This mode of operation, for example for NYC, will output seven files:
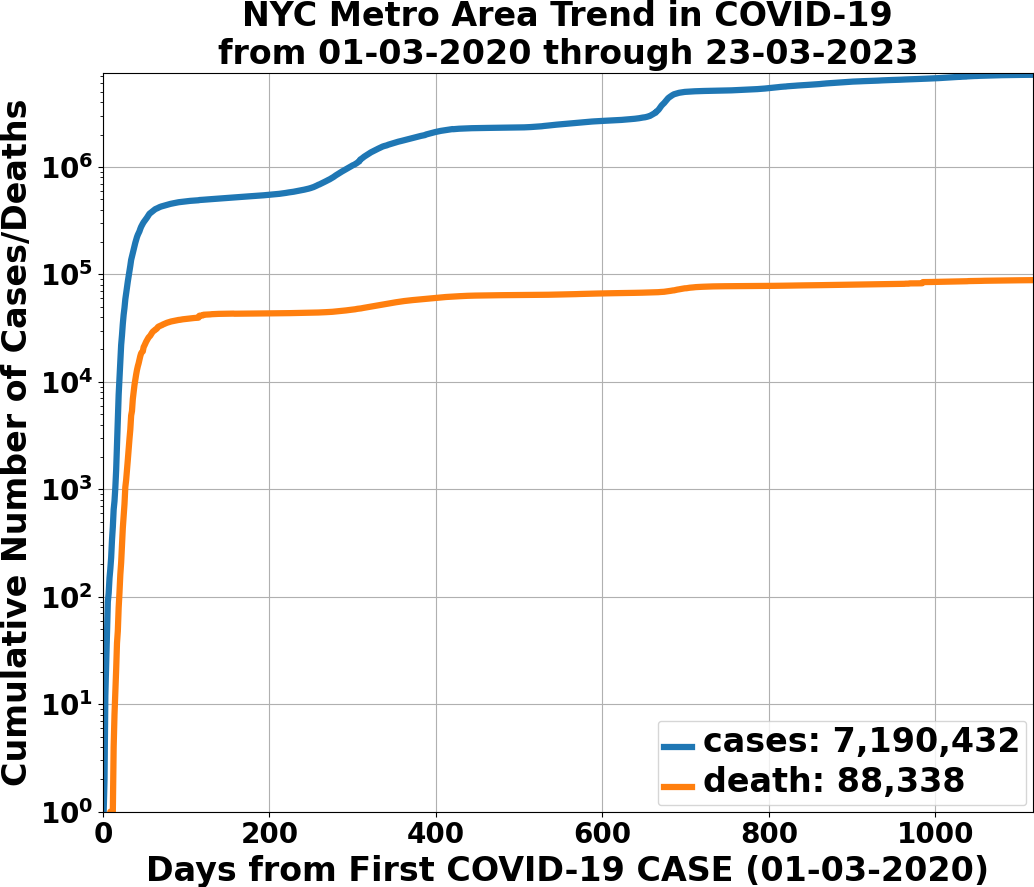
covid19_nyc_LATEST.pkl.gzis the serializedPandas DataFrameof the COVID-19 cases and deaths, total and per county, from the date of first incident to the latest incident.covid19_nyc_cds_LATEST.pdf and covid19_nyc_cds_LATEST.png are the PDF and PNG showing the trend of COVID-19 cases and deaths in the NYC metro area.

Fig. 3.2 The latest trend lines of cumulative cases and deaths in the NYC metropolitan area.
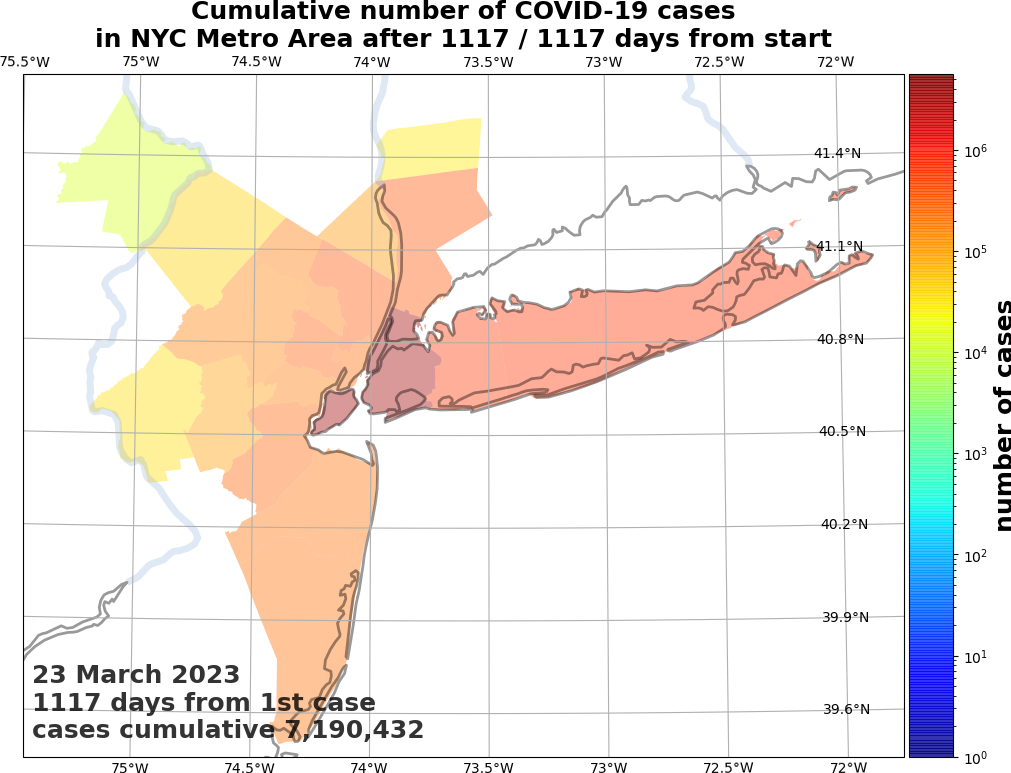
covid19_nyc_cases_LATEST.pdf and covid19_nyc_cases_LATEST.png <plots showing the are the PDF and PNG showing the county map, colored by number of COVID-19 cases, on the LAST incident day.

Fig. 3.3 The latest image of cumulative cases in the NYC metropolitan area.
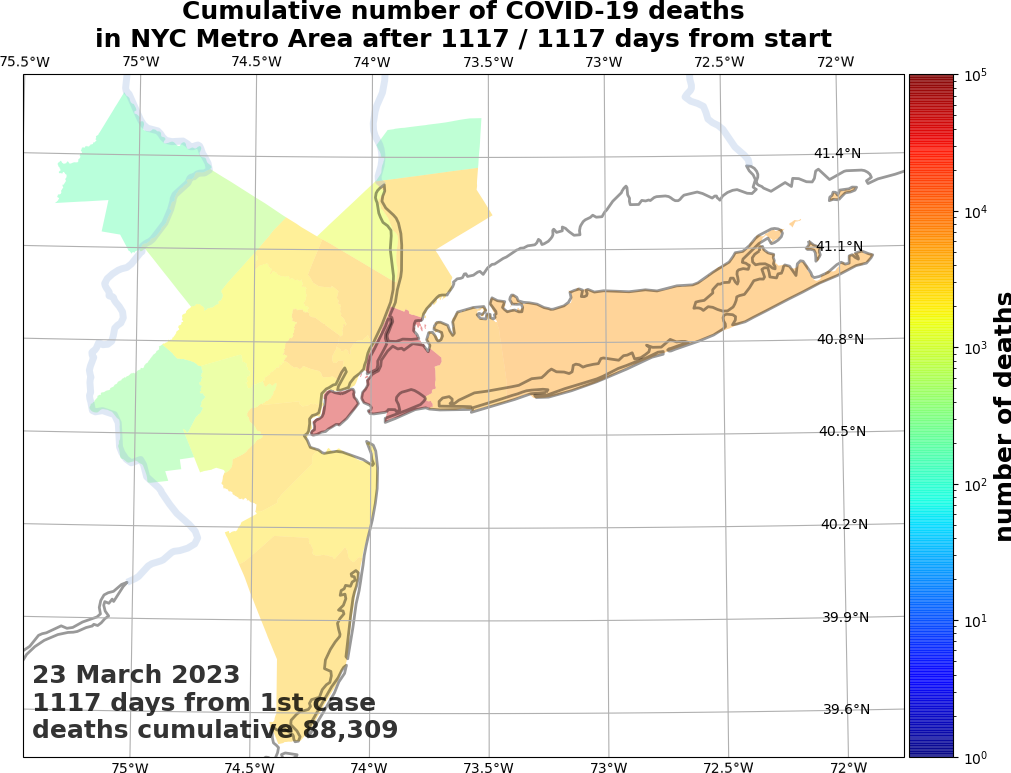
covid19_nyc_death_LATEST.pdf and covid19_nyc_death_LATEST.png are the PDF and PNG showing the county map, colored by number of COVID-19 deaths, on the LAST incident day.

Fig. 3.4 The latest image of cumulative deaths in the NYC metropolitan area.
3.2.3. movie mode
covid19_create_movie_or_summary m (MOVIE flag) creates an MP4 movie of COVID-19 cases and deaths for the MSA you specify (see the high quality GIF animations of these MP4 movies). The help output, while running covid19_create_movie_or_summary m -h, is shown below,
usage: covid19_create_movie_or_summary m [-h] [-n NAME] [-M MAXNUM] [--conus]
                                         [-y]

optional arguments:
  -h, --help            show this help message and exit
  -n NAME, --name NAME  Make a movie of this metropolitan area. Default is
                        "bayarea"
  -M MAXNUM, --maxnum MAXNUM
                        The limit of cases/deaths to visualize. Default is a
                        plausible amount for the chosen MSA or CONUS. You
                        should use a limit larger (by at least 2, no more than
                        10) than the maximum number of cases recorded for a
                        county in that MSA or CONUS.
  --conus               If chosen, then make a movie of the COVID-19 cases and
                        deaths trends for the Continental US (CONUS).
  -y, --yes             If chosen, then do not confirm --maxnum.
The meaning of the -M and -y flags are the same as in SHOW mode. This mode of operation, for example for NYC,
covid19_create_movie_or_summary m -n nyc -y
will output a quad structured movie of the cumulative COVID-19 cases and deaths for the NYC metropolitan area, covid19_nyc_LATEST.mp4. Fig. 3.5 is a GIF animation of that.

Fig. 3.5 The four-quadrant movie, that covid19_create_movie_or_summary m creates, of the cumulative COVID-19 cases and deaths in the NYC metropolitan area. Upper left quad is the summary information for the MSA. Lower left quad is the running tally of cumulative cases and deaths, by day from first incident. Upper right is logarithmic coloration of cumulative deaths, by day from first incident. Lower right is logarithmic coloration of cumulative cases, by day from first incident.
Note also that the created MP4 files have metadata associated with them. You can either inspect them using mp4info or using code in the mutagen.mp4.MP4. Here is what mp4info covid19_nyc_LATEST.mp4 returns,
mp4info version -r
covid19_nyc_LATEST.mp4:
Track   Type    Info
1       video   H264 High@4, 67.200 secs, 160 kbps, 1590x1172 @ 5.000000 fps
 Name: nyc, ALL, 30-01-2021
 Artist: Tanim Islam
 Encoded with: Lavf57.56.101
 Release Date: 30-01-2021
 Album: METROPOLITAN STATISTICAL AREA
For MSAs,
Album is
METROPOLITAN STATISTICAL AREA.Artist is Tanim Islam (duh).
Name is MSA name,
ALLif showing cases and deaths as quads in one movie (this is what covid19_nyc_LATEST.mp4 shows), and the last date of COVID-19 cases and deaths that are reported.Release Date is also the last date of COVID-19 cases and deaths that are reported.
For the CONUS, such as covid19_conus_LATEST.mp4, here is the output when running mp4info,
mp4info version -r
covid19_conus_LATEST.mp4:
Track   Type    Info
1       video   H264 High@5, 75.200 secs, 277 kbps, 1908x1166 @ 5.000000 fps
 Name: conus, ALL, 30-01-2021
 Artist: Tanim Islam
 Encoded with: Lavf57.56.101
 Release Date: 30-01-2021
 Album: CONUS
And here is its metadata,
Album is
CONUS.Name is
CONUS,ALLif showing cases and deaths as quads in one movie (this is what covid19_conus_LATEST.mp4 shows), and the last date of COVID-19 cases and deaths that are reported.
3.2.4. movie cases deaths mode
This is similar to movie mode, except now we can visualize movies of cases or deaths, and optionally save, the collection of PNG images used to create the movie, into a zip file. The help output, while running covid19_create_movie_or_summary mcd -h, is shown below,
usage: covid19_create_movie_or_summary mcd [-h] [-n NAME] [-d DISP] [-M MAXNUM] [-s] [--conus] [-y]

optional arguments:
  -h, --help            show this help message and exit
  -n NAME, --name NAME  Create a summary plot and incident data file of this metropolitan area. Default is "bayarea".
  -d DISP, --disp DISP  Whether to display the "cases" or "death" trends of the MSA or CONUS. Default is "cases".
  -M MAXNUM, --maxnum MAXNUM
                        The limit of cases/deaths to visualize. Default is a plausible amount for the chosen MSA or CONUS. You
                        should use a limit larger (by at least 2, no more than 10) than the maximum number of cases recorded
                        for a county in that MSA or CONUS.
  -s, --saveimages      If chosen, then save the images used to create the movie into a ZIP archive.
  --conus               If chosen, then make a movie of the COVID-19 cases and deaths trends for the Continental US (CONUS).
  -y, --yes             If chosen, then do not confirm --maxnum.
The usage of four flags – -n, -M or --maxnum, --conus, and -y or --yes – are the same as described in Section 3.2.2 and Section 3.2.3.
-dor-displets you choose whether to create a movie of thecasesordeathswithin the CONUS or a specific MSA.-sor--saveimagesoptionally lets you choose to save the PNG images into a zip archive.
Fig. 3.6 and Fig. 3.7 demonstrates this operation to create COVID-19 cases and deaths summary movies for the NYC metropolitan area. The command line syntax to generate these two movies is shown in each of their captions.

Fig. 3.6 The trend of latest COVID-19 cumulative cases (lower right quadrant in Fig. 3.5) in the NYC metropolitan area. The underlying MP4 file is covid19_nyc_cases_LATEST.mp4. The syntax used to create this movie is,
covid19_create_movie_or_summary mcd -n nyc -d cases -y

Fig. 3.7 The trend of latest COVID-19 cumulative deaths (upper right quadrant in Fig. 3.5) in the NYC metropolitan area. The underlying MP4 file is covid19_nyc_deaths_LATEST.mp4. The syntax used to create this movie is,
covid19_create_movie_or_summary mcd -n nyc -d death -y
Finally, Fig. 3.8 demonstrates the latest trend of COVID-19 cases in the CONUS. I generate it by running,
covid19_create_movie_or_summary mcd --conus -d cases -y

Fig. 3.8 The trend of latest COVID-19 cumulative cases for the CONUS. The underlying MP4 file is covid19_conus_cases_LATEST.mp4. I deliberately limit the maximum value of cases, in the colorbar, to the maximum cumulative COVID-19 deaths in a county in the region, for psychological effect; it’s distressing to see the COVID-19 cumulative case map fill up with red as time goes on.
Note also that the created MP4 files have metadata associated with them. You can either inspect them using mp4info or using code in the mutagen.mp4.MP4. Here is what mp4info covid19_nyc_cases_LATEST.mp4 returns,
mp4info version -r
covid19_nyc_cases_LATEST.mp4:
Track   Type    Info
1       video   H264 High@5, 67.800 secs, 133 kbps, 2004x1470 @ 5.000000 fps
 Name: nyc, CASES, 02-02-2021
 Artist: Tanim Islam
 Encoded with: Lavf57.56.101
 Release Date: 02-02-2021
 Album: METROPOLITAN STATISTICAL AREA
Its metadata is similar to those MP4 movies that show COVID-19 cases and deaths for MSAs. The difference is in the second element of the Name: it is CASES if the movie shows cumulative COVID-19 cases, and DEATHS if the movie shows cumulative COVID-19 deaths.
For the CONUS, here is what mp4info covid19_conus_cases_LATEST.mp4 returns,
mp4info version -r
covid19_conus_cases_LATEST.mp4:
Track   Type    Info
1       video   H264 High@4.2, 75.800 secs, 395 kbps, 2010x1056 @ 5.000000 fps
 Name: conus, CASES, 02-02-2021
 Artist: Tanim Islam
 Encoded with: Lavf57.56.101
 Release Date: 02-02-2021
 Album: CONUS
Its metadata is similar to those MP4 movies that show COVID-19 cases and deaths for the CONUS. The difference is in the second element of the Name: it is CASES if the movie shows cumulative COVID-19 cases, and DEATHS if the movie shows cumulative COVID-19 deaths.