Welcome to the COVID19_STATS repository
Hello world! This is my COVID-19 tracker. This is not nearly as sophisticated as what’s in ncov2019.live, and described in this New Yorker article.
The best example of this repository’s functionality lives at this page, COVID-19 Running Update.
The comprehensive documentation lives in HTML created with Sphinx, and now in the COVID-19 Stats GitHub Page for this project. To generate the documentation,
Go to the
docsrcsubdirectory.In that directory, run
make html.Load
docsrc/build/html/index.htmlinto a browser to see the documentation.
I have made major changes in the functionality and implementation from the original commits, since commit #78917 for instance.
The API code has been refactored into the covid19_stats.engine module, and is divided into three main submodules: covid19_stats.engine.core provides the higher level API calls for processing the COVID-19 data; covid19_stats.engine.gis provides the lower-level APIs to write out, read in, and process the raw GIS data provided mainly by the US Census Bureau; and covid19_stats.engine.viz and covid19_stats.engine.viz2 do the visualization parts.
The command line interfaces (CLI) back-ends live in
covid19_stats.cli. One of the command line interfaces, covid19_update_database, updates the git submodule (the NY Times COVID-19 repository) with the latest data. Previously, one updated the database by manually running, from the repository’s top level directory,git -C covid19_stats/covid-19-data pull origin masterThe
testingsubdirectory contains Jupyter Notebooks that illuminate bits and pieces of this COVID-19 tracker’s functionality. It also consists of Jupyter Notebooks that create output for the API documentation.testing/covid19_excuse_gis_visualizations.ipynbshows output for the covid19_stats.engine.gis module documentation.testing/covid19_excuse_core_visualizations.ipynbshows output for the covid19_stats.engine.core module documentation.testing/covid19_excuse_main_visualizations.ipynbshows output for the covid19_stats module documentation, and specifically the COVID19Database object.testing/covid19_excuse_viz_visualizations.ipynbshows output for the covid19_stats.engine.viz module documentation.testing/covid19_excuse_viz2_visualizations.ipynbshows output for the covid19_stats.engine.viz2 module documentation.
Here is some output from using this COVID-19 tracker. The data lives underneath https://tanimislam.sfo3.digitaloceanspaces.com/covid19movies.
The summary of COVID-19 statistics for the top 50 MSAs by estimated 2019 population.
Table 1 COVID-19 STATS FOR 50 METROS AS OF 23 MARCH 2023 RANK
IDENTIFIER
NAME
POPULATION
FIRST INC.
NUM DAYS
NUM CASES
NUM DEATHS
MAX CASE COUNTY
MAX CASE COUNTY NAME
1
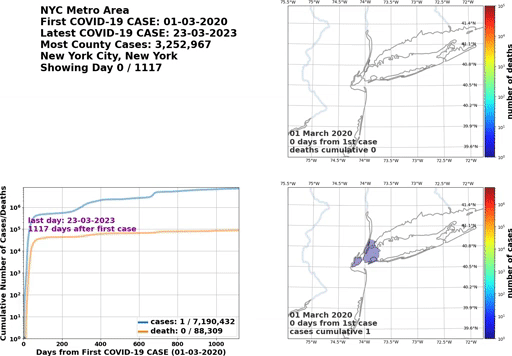
nyc
NYC Metro Area
19,216,182
01 March 2020
1117
7,190,432
88,338
3,252,967
New York City, New York
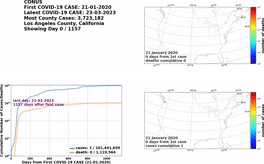
2
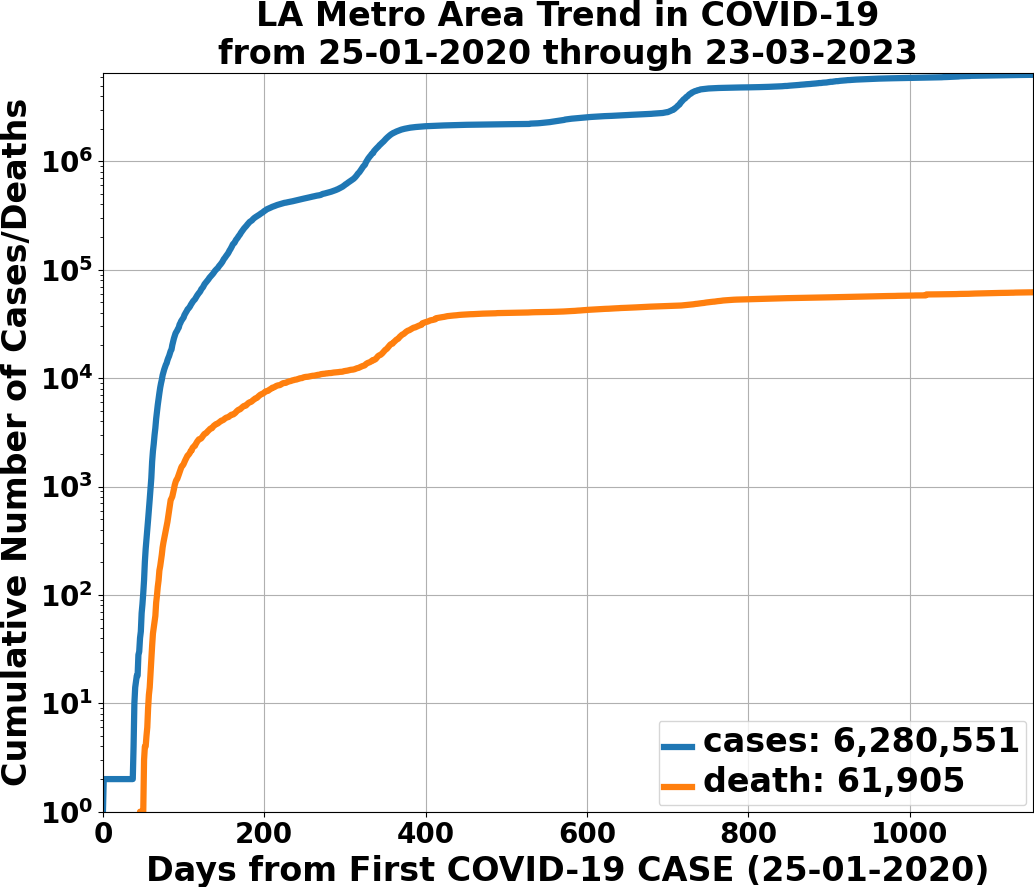
losangeles
LA Metro Area
18,711,436
25 January 2020
1153
6,280,551
61,905
3,723,182
Los Angeles County, California
3
chicago
Chicago Metro Area
9,458,539
24 January 2020
1154
2,871,273
27,213
1,541,156
Cook County, Illinois
4
dallas
Dallas Metro Area
7,573,136
09 March 2020
1109
2,194,378
20,131
696,583
Dallas County, Texas
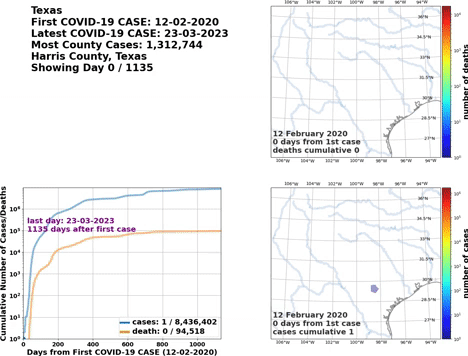
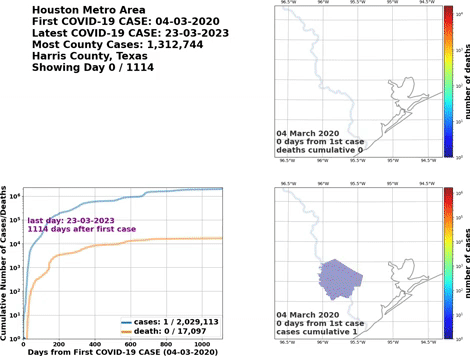
5
houston
Houston Metro Area
7,066,141
04 March 2020
1114
2,029,113
17,097
1,312,744
Harris County, Texas
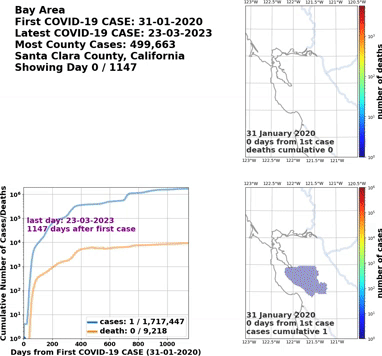
6
bayarea
Bay Area
6,860,207
31 January 2020
1147
1,717,447
9,218
499,663
Santa Clara County, California
7
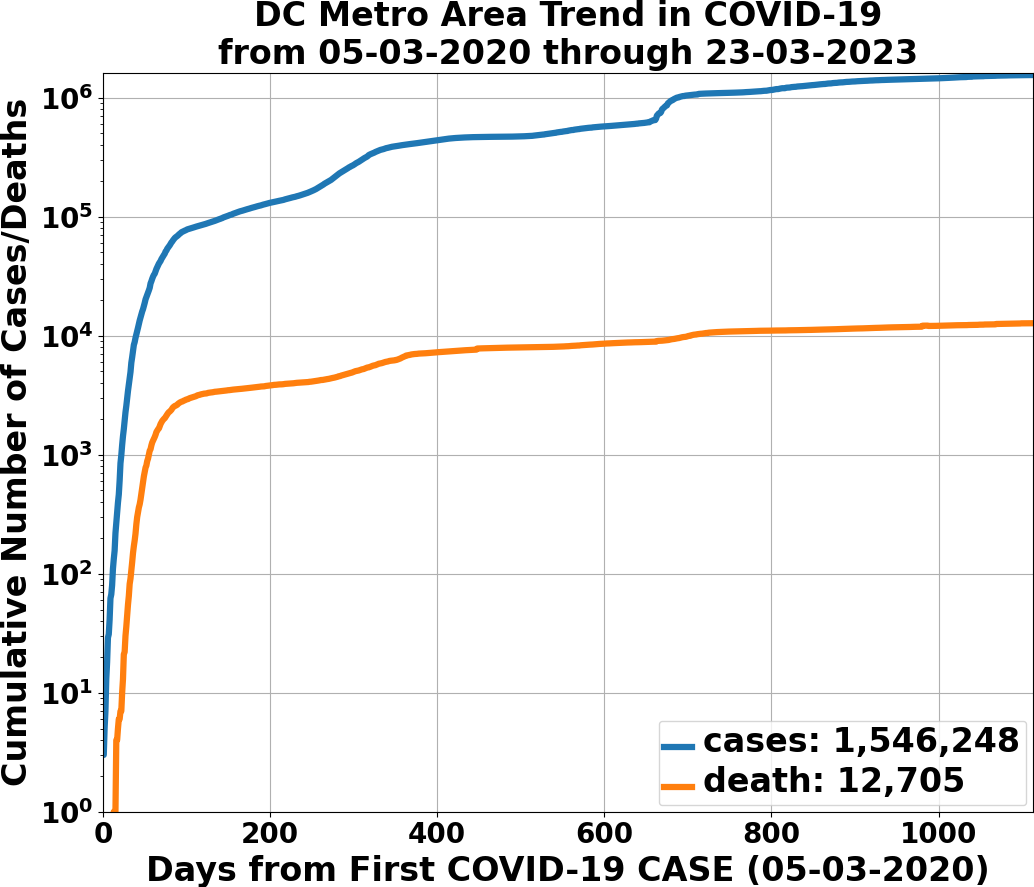
dc
DC Metro Area
6,280,487
05 March 2020
1113
1,546,248
12,705
262,100
Fairfax County, Virginia
8
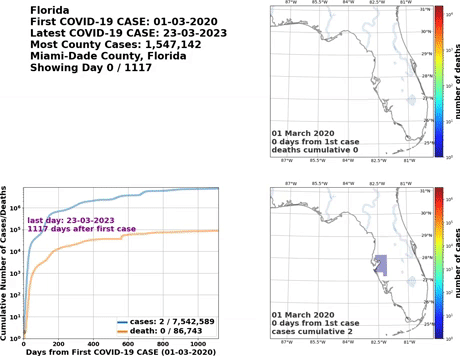
miami
Miami Metro Area
6,166,488
06 March 2020
1112
2,800,167
25,171
1,547,142
Miami-Dade County, Florida
9
philadelphia
Philadelphia Metro Area
6,102,434
06 March 2020
1112
1,645,608
20,466
395,740
Philadelphia County, Pennsylvania
10
atlanta
Atlanta Metro Area
6,020,364
02 March 2020
1116
1,657,248
18,143
277,539
Fulton County, Georgia
11
phoenix
Phoenix Metro Area
4,948,203
26 January 2020
1152
1,691,263
20,695
1,533,874
Maricopa County, Arizona
12
boston
Boston Metro Area
4,873,019
01 February 2020
1146
1,404,845
15,592
438,519
Middlesex County, Massachusetts
13
detroit
Detroit Metro Area
4,319,629
10 March 2020
1108
1,363,358
20,332
539,858
Wayne County, Michigan
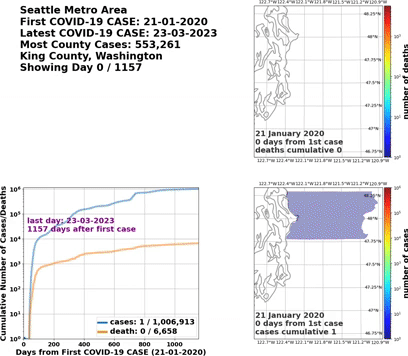
14
seattle
Seattle Metro Area
3,979,845
21 January 2020
1157
1,006,913
6,658
553,261
King County, Washington
15
minneapolis
Minneapolis Metro Area
3,640,043
06 March 2020
1112
1,132,704
8,601
387,288
Hennepin County, Minnesota
16
sandiego
San Diego Metro Area
3,338,330
10 February 2020
1137
1,070,803
6,047
1,070,803
San Diego County, California
17
tampa
Tampa Metro Area
3,194,831
01 March 2020
1117
968,486
12,077
479,357
Hillsborough County, Florida
18
denver
Denver Metro Area
2,967,239
05 March 2020
1113
883,998
6,663
225,860
Denver County, Colorado
19
stlouis
St. Louis Metro Area
2,803,228
07 March 2020
1111
865,458
9,542
296,063
St. Louis County, Missouri
20
baltimore
Baltimore Metro Area
2,800,053
08 March 2020
1110
595,175
7,853
173,005
Baltimore County, Maryland
21
charlotte
Charlotte Metro Area
2,636,883
11 March 2020
1107
896,428
6,971
369,208
Mecklenburg County, North Carolina
22
orlando
Orlando Metro Area
2,608,147
12 March 2020
1106
858,905
7,693
474,111
Orange County, Florida
23
sanantonio
San Antonio Metro Area
2,550,960
12 February 2020
1135
849,538
8,414
703,566
Bexar County, Texas
24
portland
Portland Metro Area
2,492,412
28 February 2020
1119
527,440
4,598
172,262
Multnomah County, Oregon
25
sacramento
Sacramento Metro Area
2,363,730
21 February 2020
1126
597,455
5,164
411,261
Sacramento County, California
26
pittsburgh
Pittsburgh Metro Area
2,317,600
13 March 2020
1105
667,117
8,998
341,178
Allegheny County, Pennsylvania
27
lasvegas
Las Vegas Metro Area
2,266,715
05 March 2020
1113
673,021
9,334
673,021
Clark County, Nevada
28
austin
Austin Metro Area
2,227,083
13 March 2020
1105
614,436
3,894
321,234
Travis County, Texas
29
cincinnati
Cincinnati Metro Area
2,221,208
14 March 2020
1104
686,757
6,566
238,972
Hamilton County, Ohio
30
kansascity
Kansas City Metro Area
2,157,990
07 March 2020
1111
494,211
5,923
178,806
Johnson County, Kansas
31
columbus
Columbus Metro Area
2,122,271
14 March 2020
1104
606,759
5,063
368,131
Franklin County, Ohio
32
indianapolis
Indianapolis Metro Area
2,074,537
06 March 2020
1112
598,631
7,157
269,091
Marion County, Indiana
33
cleveland
Cleveland Metro Area
2,048,449
09 March 2020
1109
576,914
6,880
352,387
Cuyahoga County, Ohio
34
nashville
Nashville Metro Area
1,934,317
05 March 2020
1113
670,163
6,146
247,844
Davidson County, Tennessee
35
virginiabeach
Virginia Beach Metro Area
1,768,901
09 March 2020
1109
454,619
4,514
116,063
Virginia Beach city, Virginia
36
providence
Providence Metro Area
1,624,578
14 March 2020
1104
614,356
6,482
279,407
Providence County, Rhode Island
37
milwaukee
Milwaukee Metro Area
1,575,179
11 March 2020
1107
558,337
4,340
343,004
Milwaukee County, Wisconsin
38
jacksonville
Jacksonville Metro Area
1,559,514
10 March 2020
1108
501,569
6,066
317,809
Duval County, Florida
39
oklahomacity
Oklahoma City Metro Area
1,408,950
13 March 2020
1105
450,729
4,863
246,781
Oklahoma County, Oklahoma
40
raleigh
Raleigh Metro Area
1,390,785
03 March 2020
1115
495,079
1,962
392,474
Wake County, North Carolina
41
memphis
Memphis Metro Area
1,346,045
08 March 2020
1110
438,084
5,394
299,438
Shelby County, Tennessee
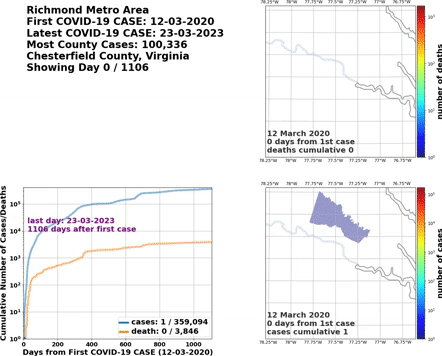
42
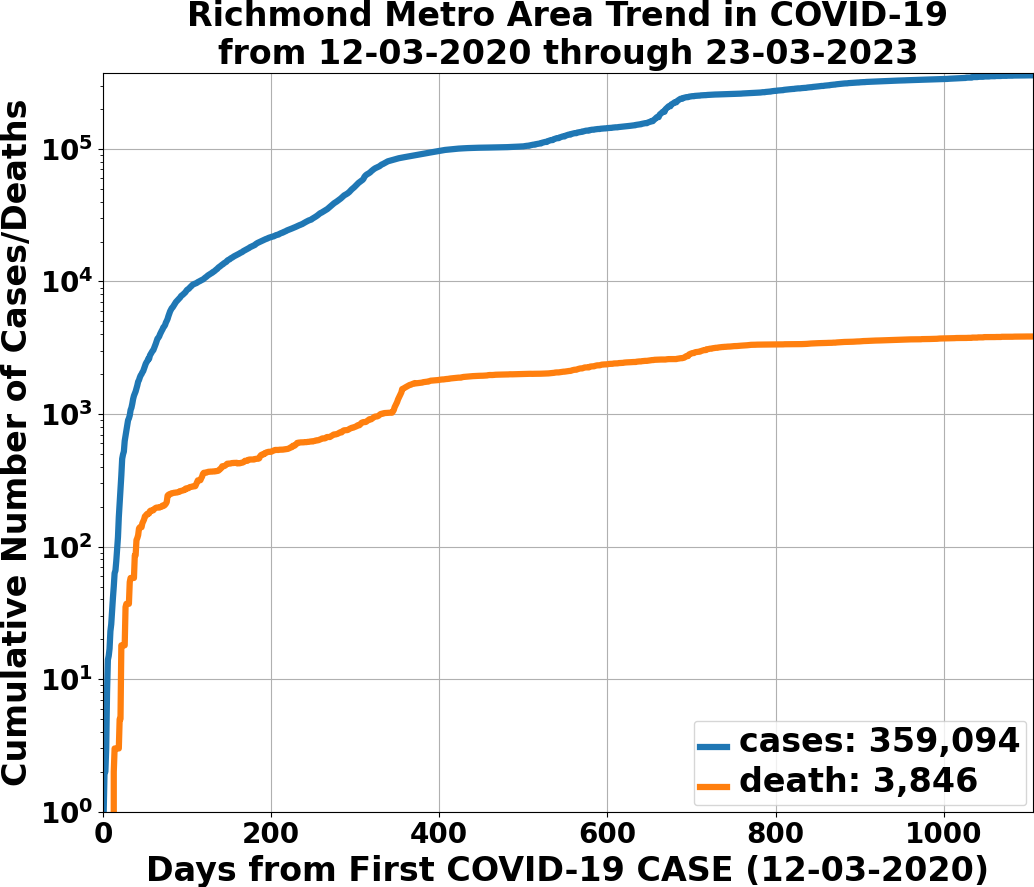
richmond
Richmond Metro Area
1,291,900
12 March 2020
1106
359,094
3,846
100,336
Chesterfield County, Virginia
43
neworleans
New Orleans Metro Area
1,270,530
09 March 2020
1109
409,797
4,230
142,848
Jefferson Parish, Louisiana
44
louisville
Louisville/Jefferson County Metro Area
1,265,108
08 March 2020
1110
454,689
4,475
284,727
Jefferson County, Kentucky
45
saltlakecity
Salt Lake City Metro Area
1,232,696
25 February 2020
1122
436,606
1,955
411,491
Salt Lake County, Utah
46
hartford
Hartford Metro Area
1,204,877
14 March 2020
1104
304,527
4,375
237,616
Hartford County, Connecticut
47
buffalo
Buffalo Metro Area
1,127,983
15 March 2020
1103
332,558
3,914
272,312
Erie County, New York
48
birmingham
Birmingham Metro Area
1,090,435
13 March 2020
1105
390,905
4,069
239,299
Jefferson County, Alabama
49
grandrapids
Grand Rapids Metro Area
1,077,370
12 March 2020
1106
334,190
3,272
202,691
Kent County, Michigan
50
rochester
Rochester Metro Area
1,069,644
11 March 2020
1107
273,251
2,791
194,657
Monroe County, New York
The COVID-19 trends in cases and deaths for these 6 metropolitan areas as of 23 MARCH 2023: SF Bay Area; Washington, DC; Richmond, VA; NYC; Los Angeles; and New Orleans.
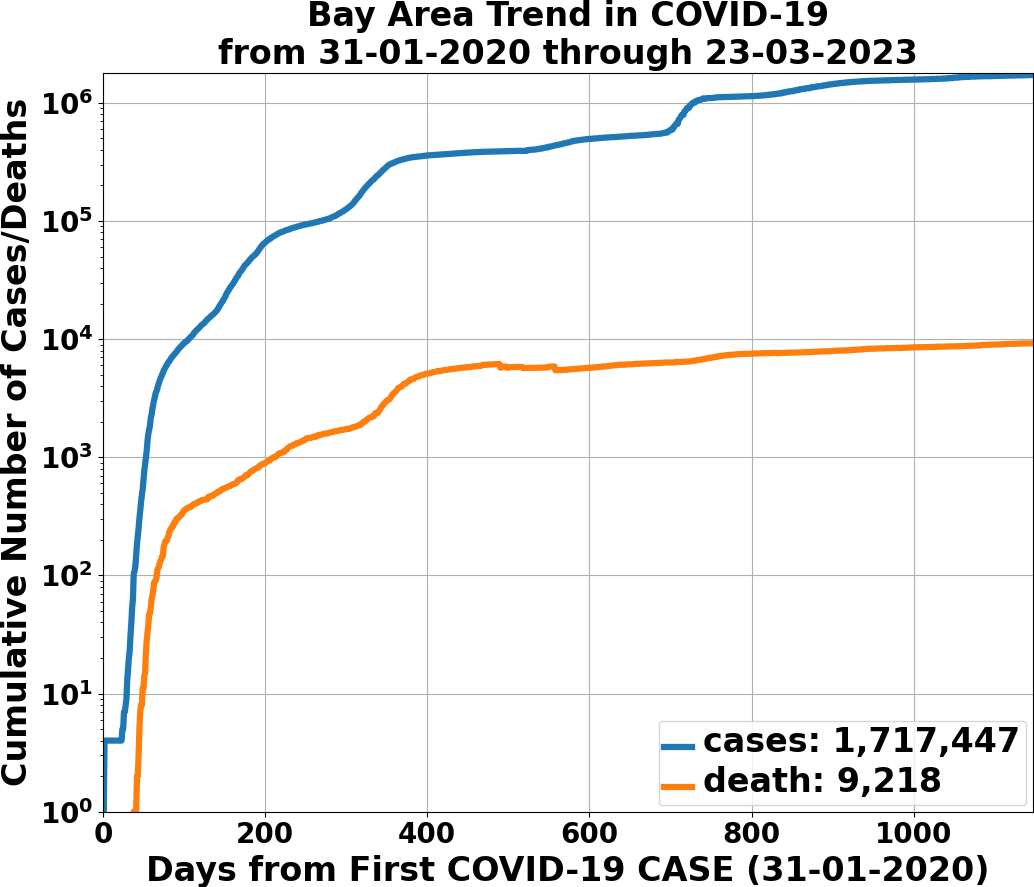
SF Bay Area
Washington, DC
Richmond, VA
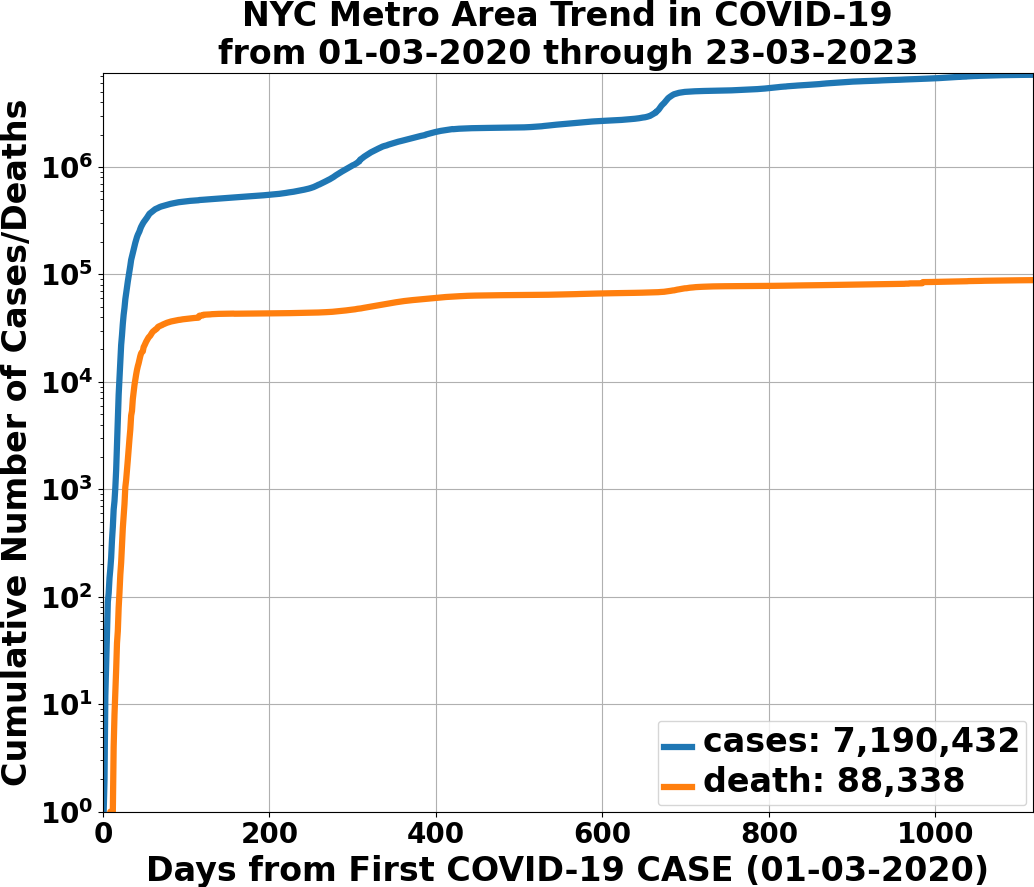

NYC Metro
Los Angeles
New Orleans
GIF’d video animations of the COVID-19 trends in cases/deaths for NYC, Chicago, Seattle, SF Bay Area, DC, and Richmond, as of 23 MARCH 2023.


And here is the animation for the continental United States as of 23 MARCH 2023
GIF’d video animations of the COVID-19 trends in cases/deaths for California, Texas, Florida, and Virginia, as of 23 MARCH 2023.